HSDS auxiliary variables
HSDS auxiliary variables#
The HSDS provides some additional variables not available through the HTTP API. They aren’t particularly relevant for PV modeling, but at least they make nice maps.
[1]:
import h5pyd
import matplotlib.pyplot as plt
import cartopy
import cartopy.crs as ccrs
import numpy as np
import pandas as pd

f = h5pyd.File("/nrel/nsrdb/v3/nsrdb_2020.h5", 'r')  # requires a ~/.hscfg file
print(f.attrs['version'])
3.2.0
[ ]:
%time meta = pd.DataFrame(f['meta'][...])
[5]:
extent = [-180, -22.5, -21, 60]
[13]:
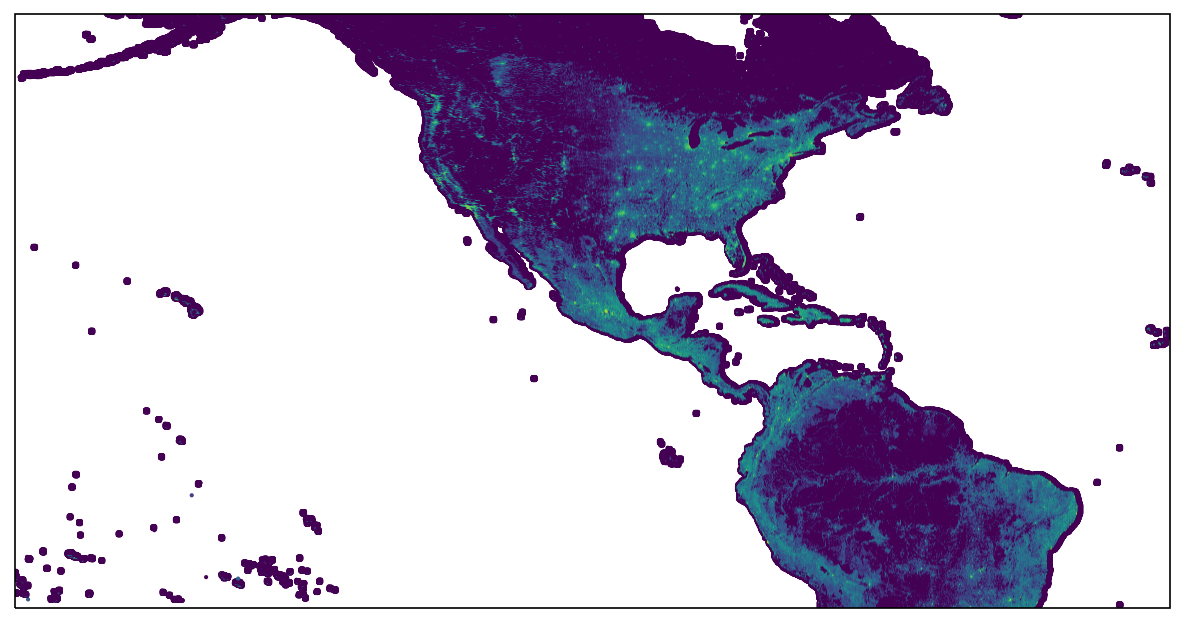
fig = plt.figure(figsize=(8, 6), dpi=150)
ax = fig.add_subplot(1, 1, 1, projection=ccrs.PlateCarree())
ax.set_extent(extent, crs=ccrs.PlateCarree())
color = np.log10(meta['population'])
color[~np.isfinite(color)] = 0
ax.scatter(meta['longitude'], meta['latitude'], c=color, s=1, transform=ccrs.PlateCarree())
fig.tight_layout()
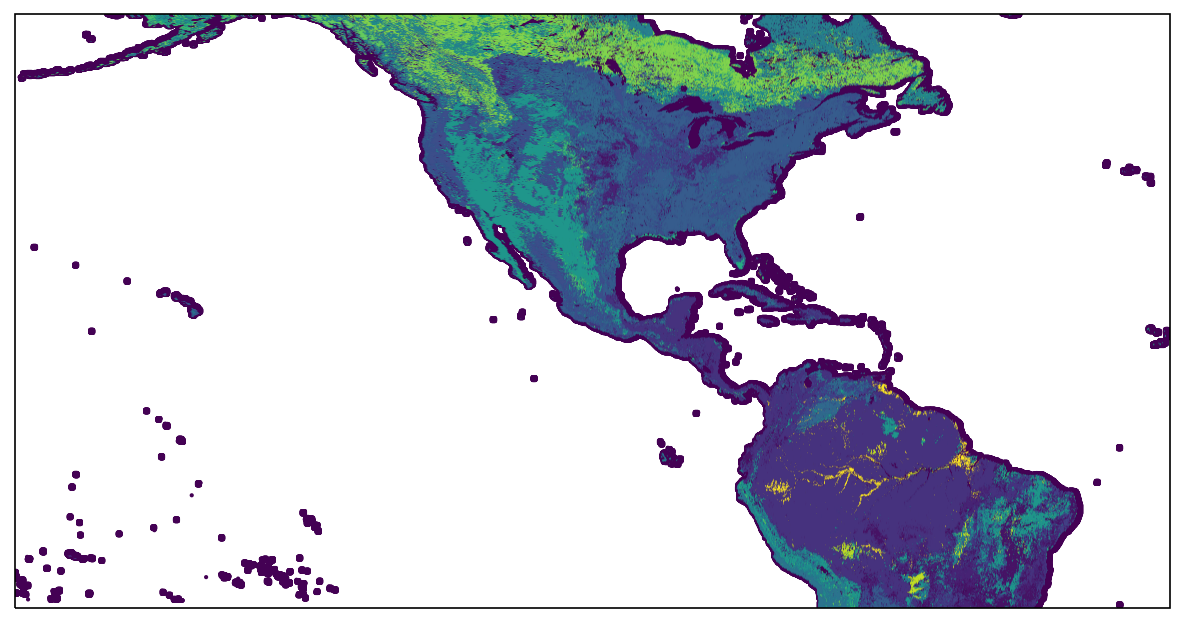
[15]:
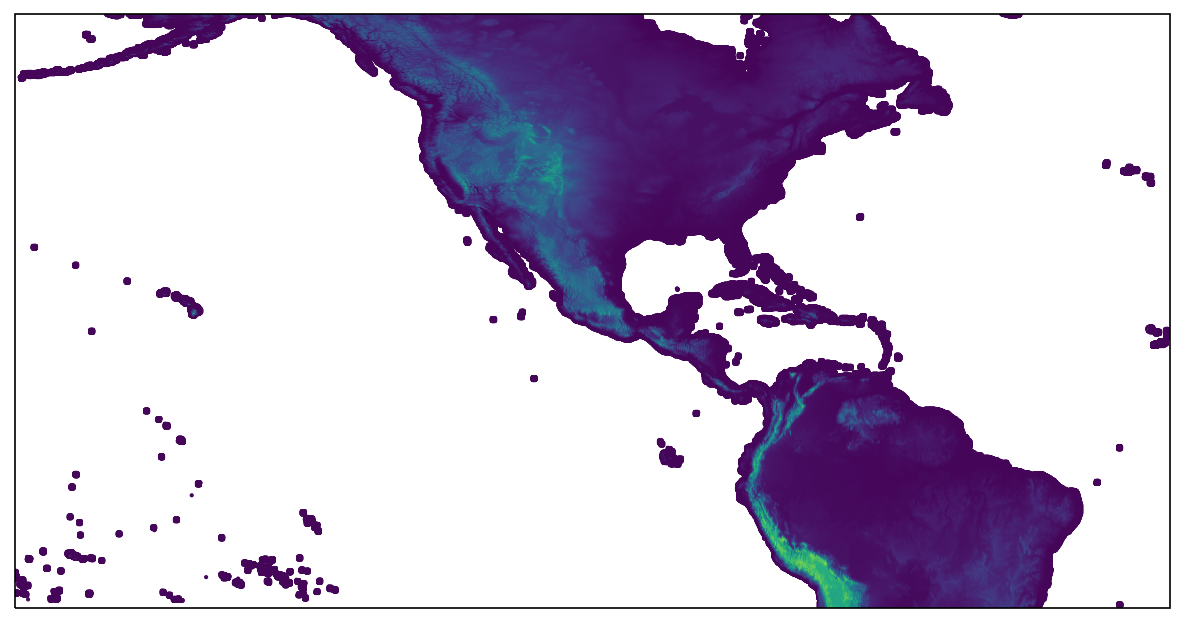
fig = plt.figure(figsize=(8, 6), dpi=150)
ax = fig.add_subplot(1, 1, 1, projection=ccrs.PlateCarree())
ax.set_extent(extent, crs=ccrs.PlateCarree())
ax.scatter(meta['longitude'], meta['latitude'], c=meta['elevation'], s=1, transform=ccrs.PlateCarree())
fig.tight_layout()
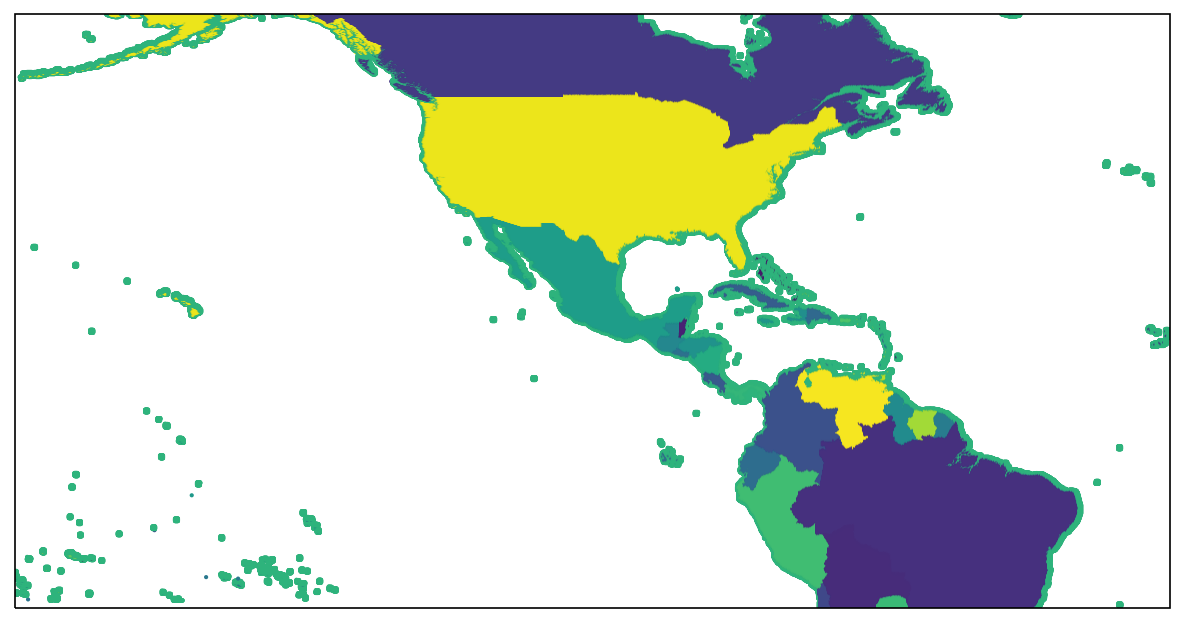
[27]:
fig = plt.figure(figsize=(8, 6), dpi=150)
ax = fig.add_subplot(1, 1, 1, projection=ccrs.PlateCarree())
ax.set_extent(extent, crs=ccrs.PlateCarree())
ax.scatter(meta['longitude'], meta['latitude'], c=meta['country'].factorize(sort=True)[0], s=1, transform=ccrs.PlateCarree())
fig.tight_layout()
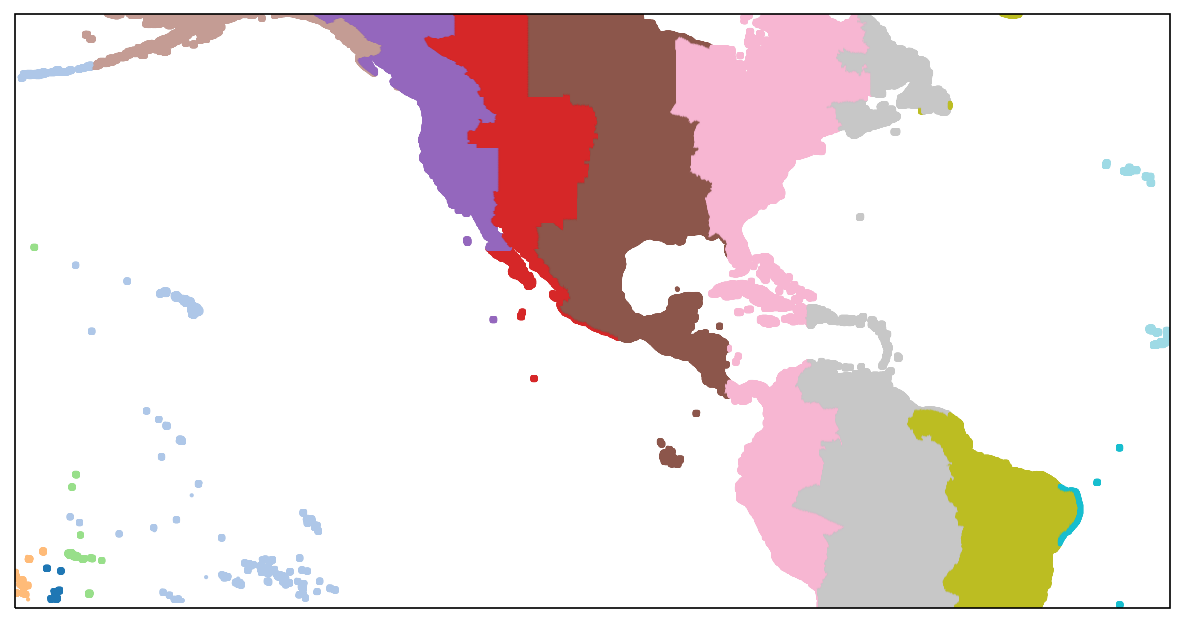
[26]:
fig = plt.figure(figsize=(8, 6), dpi=150)
ax = fig.add_subplot(1, 1, 1, projection=ccrs.PlateCarree())
ax.set_extent(extent, crs=ccrs.PlateCarree())
ax.scatter(meta['longitude'], meta['latitude'], c=meta['state'].factorize(sort=True)[0], s=1, transform=ccrs.PlateCarree())
fig.tight_layout()
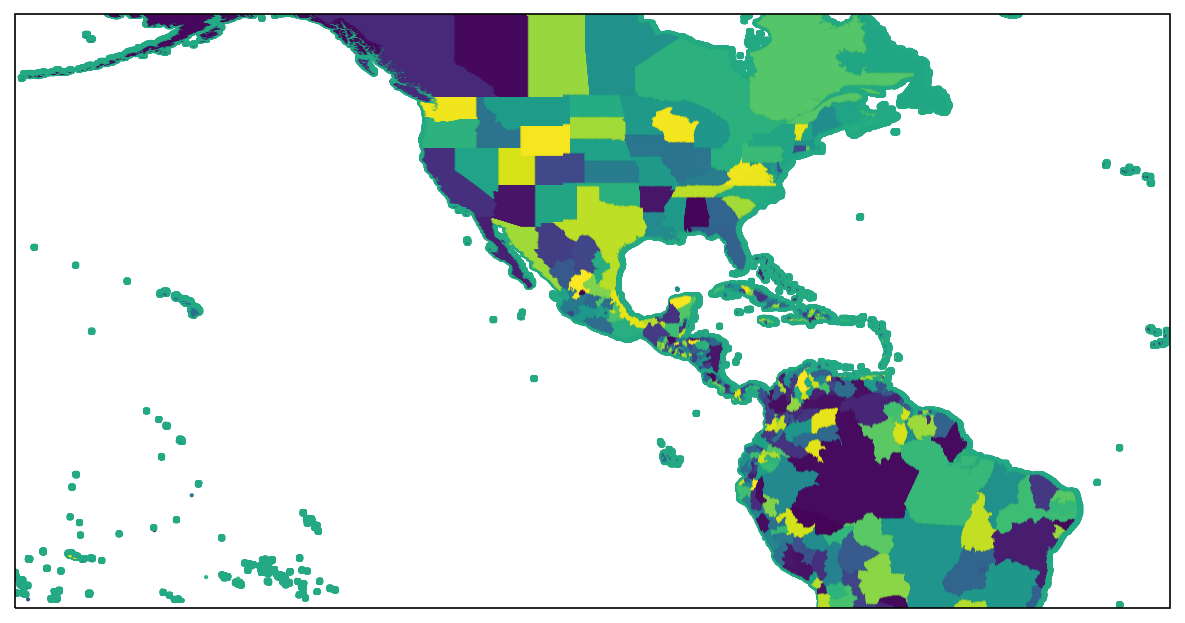
[28]:
fig = plt.figure(figsize=(8, 6), dpi=150)
ax = fig.add_subplot(1, 1, 1, projection=ccrs.PlateCarree())
ax.set_extent(extent, crs=ccrs.PlateCarree())
ax.scatter(meta['longitude'], meta['latitude'], c=meta['county'].factorize(sort=True)[0], s=1, transform=ccrs.PlateCarree())
fig.tight_layout()
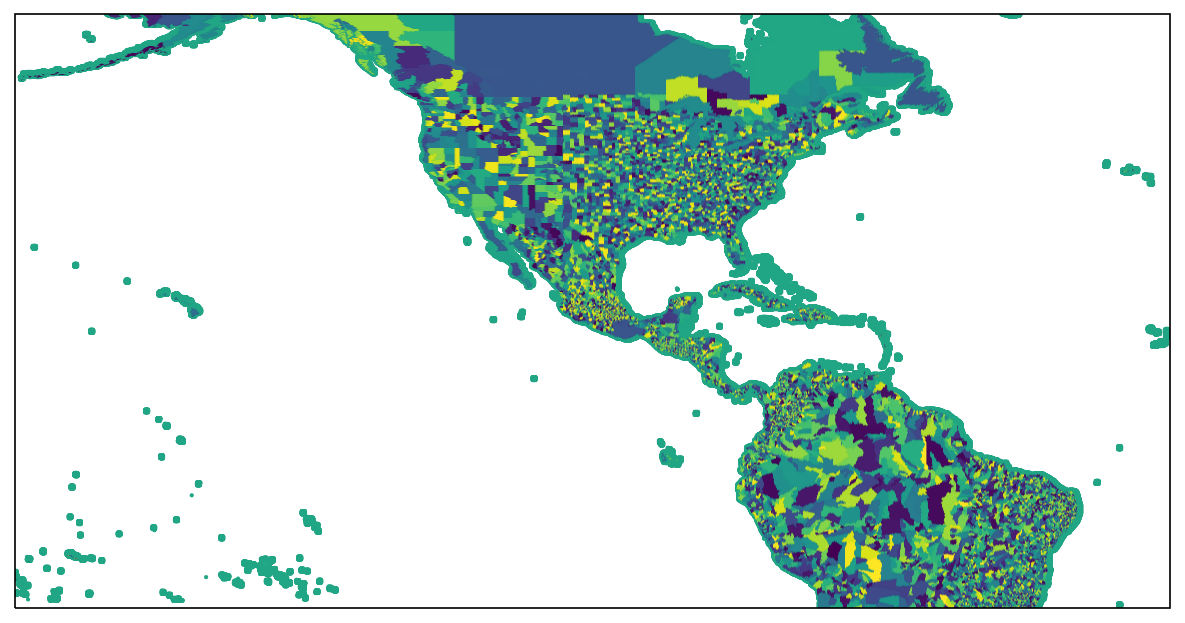
[20]:
fig = plt.figure(figsize=(8, 6), dpi=150)
ax = fig.add_subplot(1, 1, 1, projection=ccrs.PlateCarree())
ax.set_extent(extent, crs=ccrs.PlateCarree())
ax.scatter(meta['longitude'], meta['latitude'], c=meta['landcover'].factorize()[0], s=1, transform=ccrs.PlateCarree())
fig.tight_layout()
[35]:
fig = plt.figure(figsize=(8, 6), dpi=150)
ax = fig.add_subplot(1, 1, 1, projection=ccrs.PlateCarree())
ax.set_extent(extent, crs=ccrs.PlateCarree())
ax.scatter(meta['longitude'], meta['latitude'], c=meta['timezone'].factorize()[0], s=1, transform=ccrs.PlateCarree(), cmap='tab20')
fig.tight_layout()
[36]:
%load_ext watermark
%watermark --iversions -u -d -t
Last updated: 2022-09-21 20:46:38

cartopy   : 0.18.0
h5pyd     : 0.11.0
numpy     : 1.22.3
pandas    : 1.5.0
matplotlib: 3.5.2
[ ]: