TMY versus Single-Year
TMY versus Single-Year#
TMYs are built from monthly segments pulled from actual (single-year) data. As such, one might expect each month in a TMY dataset to be identical to the same month in the corresponding single-year data. This notebook demonstrates that this expectation does not exactly hold for PSM3.
[1]:
import pvlib
import numpy as np
import pandas as pd
import matplotlib.pyplot as plt
First, let’s fetch a normal TMY file. I specify names='tmy-2020' so that this notebook fetches the same TMY data in the future.
[2]:
kwargs = dict(latitude=40, longitude=-80, api_key='DEMO_KEY', email='assessingsolar@gmail.com',
              map_variables=True, leap_day=True)
real_tmy = pvlib.iotools.get_psm3(names='tmy-2020', **kwargs)[0].drop(columns=['Year', 'Month', 'Day', 'Hour', 'Minute'])
[3]:
real_tmy.head(10)
[3]:
| pressure | albedo | wind_speed | temp_air | Dew Point | dni | ghi | wind_direction | dhi | |
|---|---|---|---|---|---|---|---|---|---|
| 1999-01-01 00:30:00-05:00 | 970.0 | 0.87 | 0.6 | -6.0 | -10.0 | 0.0 | 0.0 | 256.0 | 0.0 |
| 1999-01-01 01:30:00-05:00 | 970.0 | 0.87 | 0.6 | -7.0 | -10.0 | 0.0 | 0.0 | 258.0 | 0.0 |
| 1999-01-01 02:30:00-05:00 | 970.0 | 0.87 | 0.6 | -7.0 | -11.0 | 0.0 | 0.0 | 262.0 | 0.0 |
| 1999-01-01 03:30:00-05:00 | 970.0 | 0.87 | 0.6 | -7.0 | -12.0 | 0.0 | 0.0 | 265.0 | 0.0 |
| 1999-01-01 04:30:00-05:00 | 970.0 | 0.87 | 0.6 | -7.0 | -12.0 | 0.0 | 0.0 | 270.0 | 0.0 |
| 1999-01-01 05:30:00-05:00 | 970.0 | 0.87 | 0.6 | -8.0 | -13.0 | 0.0 | 0.0 | 275.0 | 0.0 |
| 1999-01-01 06:30:00-05:00 | 970.0 | 0.87 | 0.6 | -8.0 | -13.0 | 0.0 | 0.0 | 280.0 | 0.0 |
| 1999-01-01 07:30:00-05:00 | 970.0 | 0.87 | 0.6 | -8.0 | -14.0 | 0.0 | 0.0 | 280.0 | 0.0 |
| 1999-01-01 08:30:00-05:00 | 980.0 | 0.87 | 0.6 | -8.0 | -14.0 | 497.0 | 98.0 | 279.0 | 39.0 |
| 1999-01-01 09:30:00-05:00 | 980.0 | 0.87 | 0.6 | -7.0 | -14.0 | 712.0 | 258.0 | 283.0 | 72.0 |
Now, let’s build the same TMY using the corresponding single-year data:
[4]:
dfs = []
for year in np.unique(real_tmy.index.year):
    dfs.append(pvlib.iotools.get_psm3(names=year, **kwargs)[0].drop(columns=['Year', 'Month', 'Day', 'Hour', 'Minute']))

df = pd.concat(dfs)
fake_tmy = df.reindex(real_tmy.index)
[5]:
fake_tmy.head(10)
[5]:
| pressure | albedo | wind_speed | temp_air | Dew Point | dni | ghi | wind_direction | dhi | |
|---|---|---|---|---|---|---|---|---|---|
| 1999-01-01 00:30:00-05:00 | 970.0 | 0.866 | 0.6 | -6.0 | -10.0 | 0.0 | 0.0 | 256.3 | 0.0 |
| 1999-01-01 01:30:00-05:00 | 970.0 | 0.866 | 0.6 | -7.0 | -10.0 | 0.0 | 0.0 | 258.3 | 0.0 |
| 1999-01-01 02:30:00-05:00 | 970.0 | 0.866 | 0.6 | -7.0 | -11.0 | 0.0 | 0.0 | 261.5 | 0.0 |
| 1999-01-01 03:30:00-05:00 | 970.0 | 0.866 | 0.6 | -7.0 | -12.0 | 0.0 | 0.0 | 265.1 | 0.0 |
| 1999-01-01 04:30:00-05:00 | 970.0 | 0.866 | 0.6 | -7.0 | -12.0 | 0.0 | 0.0 | 269.7 | 0.0 |
| 1999-01-01 05:30:00-05:00 | 970.0 | 0.866 | 0.6 | -8.0 | -13.0 | 0.0 | 0.0 | 275.0 | 0.0 |
| 1999-01-01 06:30:00-05:00 | 970.0 | 0.866 | 0.6 | -8.0 | -13.0 | 0.0 | 0.0 | 279.6 | 0.0 |
| 1999-01-01 07:30:00-05:00 | 970.0 | 0.866 | 0.6 | -8.0 | -14.0 | 0.0 | 0.0 | 280.4 | 0.0 |
| 1999-01-01 08:30:00-05:00 | 980.0 | 0.866 | 0.6 | -8.0 | -14.0 | 497.0 | 98.0 | 279.4 | 39.0 |
| 1999-01-01 09:30:00-05:00 | 980.0 | 0.866 | 0.6 | -7.0 | -14.0 | 712.0 | 258.0 | 283.2 | 72.0 |
Right away we can see that wind_direction is somewhat different. Note also that albedo is different, although it’s a precision difference rather than truly different values. Let’s take a broader look:
[6]:
columns = ['ghi', 'dni', 'dhi', 'temp_air', 'wind_speed',
           'wind_direction', 'pressure', 'albedo', 'Dew Point']

fig, axes = plt.subplots(3, 3, figsize=(6, 6))
axes = axes.ravel()

for ax, col in zip(axes, columns):
    ax.scatter(real_tmy[col], fake_tmy[col], s=4)
    ax.set_title(col)
    ax.set_xlabel("PSM3 TMY")
    ax.set_ylabel("PSM3 Single-Year")
    x = real_tmy[col].mean()
    ax.axline((x, x), slope=1)

fig.tight_layout()
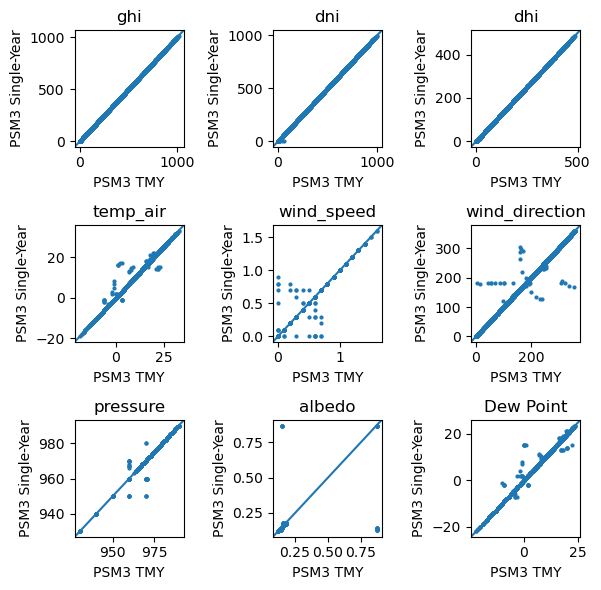
How often do the values not match up?
[7]:
(real_tmy != fake_tmy)[columns].mean()
[7]:
ghi               0.000228
dni               0.000228
dhi               0.000228
temp_air          0.005594
wind_speed        0.003995
wind_direction    0.499543
pressure          0.003653
albedo            0.792922
Dew Point         0.006279
dtype: float64
And what about just during the daytime?
[8]:
mask = real_tmy['ghi'] > 0
(real_tmy.loc[mask] != fake_tmy.loc[mask])[columns].mean()
[8]:
ghi               0.000460
dni               0.000460
dhi               0.000460
temp_air          0.000230
wind_speed        0.000230
wind_direction    0.412319
pressure          0.000230
albedo            0.774764
Dew Point         0.000460
dtype: float64
[9]:
%load_ext watermark
%watermark --iversions -u -d -t
Last updated: 2022-10-16 17:29:59

pandas    : 1.5.0
matplotlib: 3.5.2
numpy     : 1.22.3
pvlib     : 0.9.3
[ ]: